
Using a moving average indicator is widely used and basic and simple proven method many technical analysts utilize to filter out the "noise" from random fluctuations. It is a trend-following indicator. There was a prominent market technician, Robert Rhea, described the three stages of a bull market.
-During the first stage, prices recover from the oversold excesses of the preceding bear market- They rise from deeply undervalued levels back to value.
-During the second stage, rising prices reflect improving fundamentals.
-Finally, during the third and final stage, prices rally on enthusiasm, optimism, and greed.
Moving averages reflect a longer-term consensus of value.When prices crash below a moving average and drag it down, a bear move is in progress. When prices stop declining and the moving average flattens out, we need to become alert to the possibility that the bear may be dead.
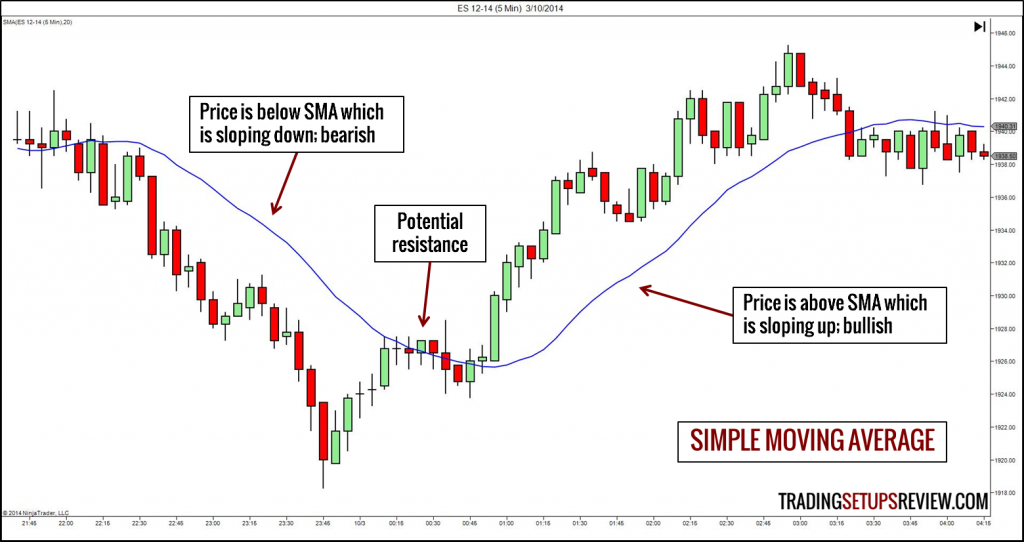
The markets run on a two-party system. When the bear party loses power, we anticipate that the next election will go to the bulls. The first target for a bullish move is a rally back to value, up to the moving average.

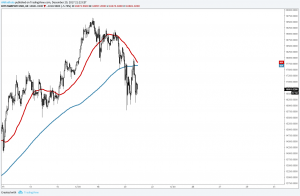
Golden Cross
One of the strategies you can use is to apply two moving averages to a chart, one longer and one shorter. When the shorter MA crosses above the longer term MA it's a buy signal as it indicates the trend is shifting up.This is known as a "golden cross." A moving average can be any length, 15, 28, 89, etc

Dead Cross
When the shorter MA crosses below the longer term MA it's a sell signal as it indicates the trend is shifting down. This is known as a "dead/death cross"
I spent a great deal of time to locate something like this
Thank you for the wonderful post
Thanks for the excellent manual
Thanks, it’s very informative
Thanks, it’s very informative
Thanks to the great guide