This prediction was the first stock prediction after I established my own theory. My theory was based on mathematical sequences and pattern recognition, also the application of the golden ratio.
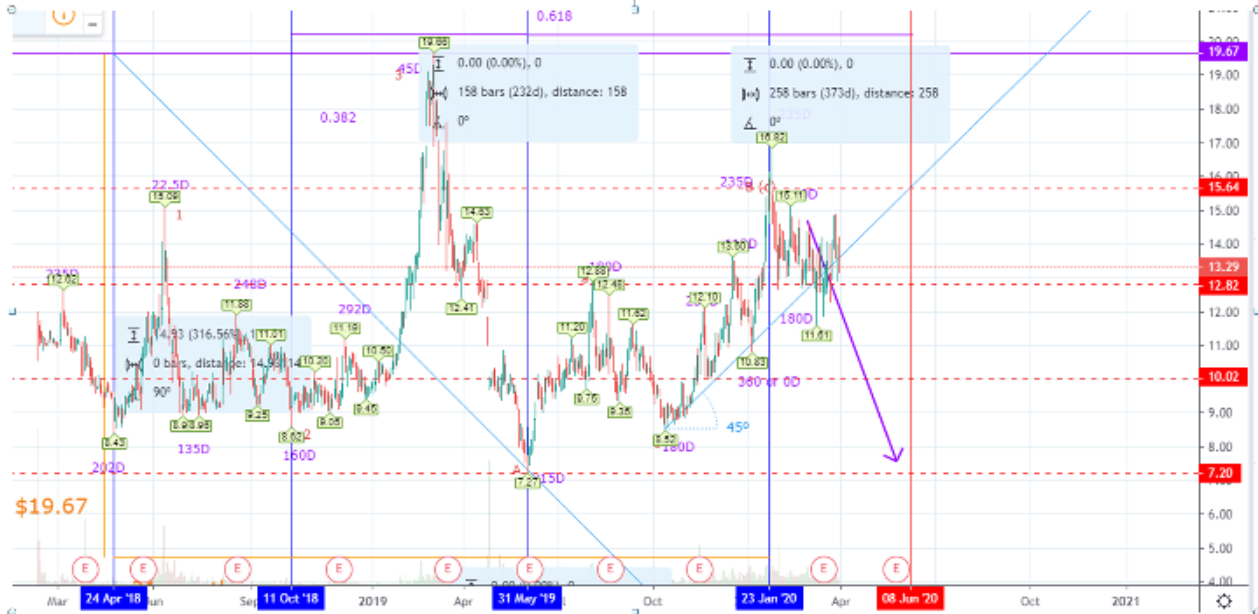
The stock, Huami Corporation (HMI) went to IPO in 2018 and started showing the predictable sequences in early 2020. Now it is trading under the ticker: ZEPP. The image below is taken at the end of March and the arrow on the image shows the movement of the future price going down from $14.50 to $9.00 around June 8th, 2020.

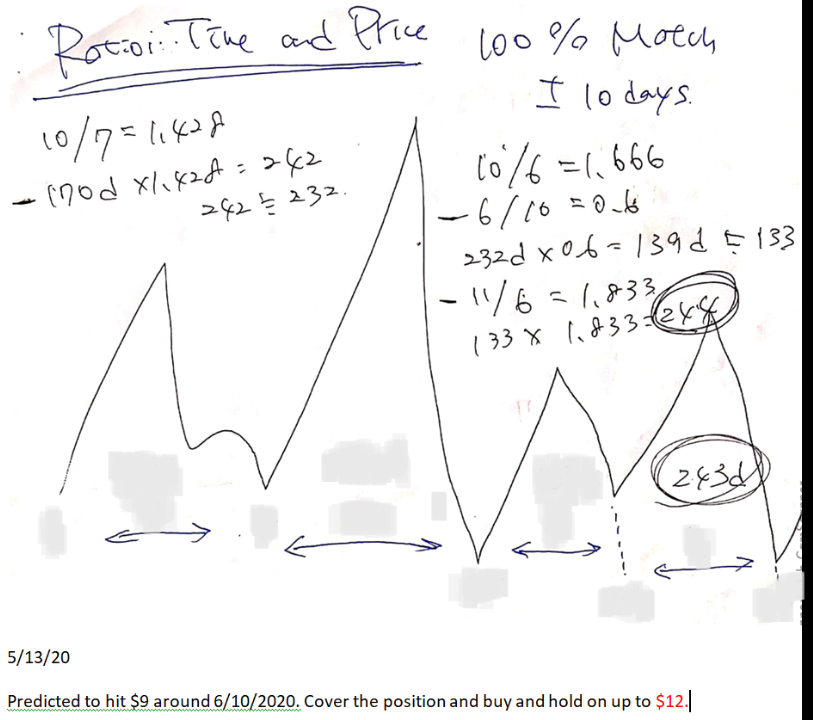
On 5/13/2020, I jotted a note which shows the part of the essential calculation and the prediction date and price at the bottom.

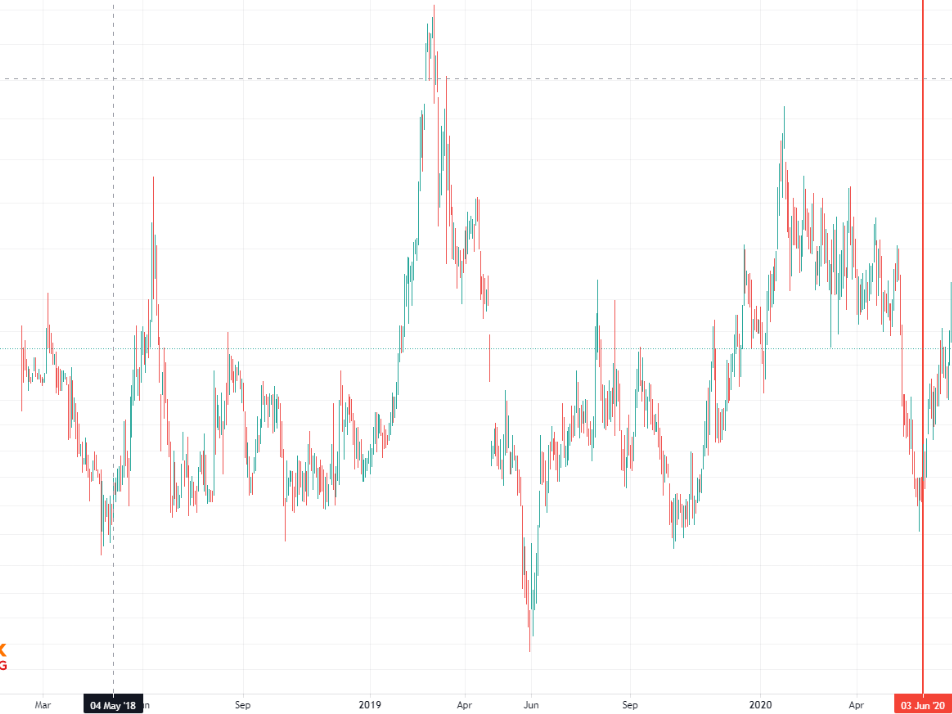
The prediction was almost perfect. I would like to give myself 98% regarding the price prediction. The price went down to $8.75 on 5/29/2020, which was just below the predicted price, $9.00. It hit the $9.00 limit and provided expected profits. This happened only one day. Great Job!
For the time prediction, I predicted it to hit $9.00 around 6/10/2020, however, it happened 11 days early. I would like to grade myself 90%, A-minus on this. It was close enough but I could have realized a little sooner if I was closely watching the price movement, or maybe not.
I was also able to buy the shares just above $9.00 after closing the short-sell and ride it up to $12.00. It did actually go up to $18.00 but I was not confident what the price would do next after hitting $12.00, the decision to get out at $12.00 was a great discipline. Do What You Know, right? It could have gone down to $9.00 who knows. The matter is I pulled it off and received the expected profit within the expected period of time.
Conclusion: I do not believe that this type of market movement happens all the time, however, 1/100 stock could provide a very predictable movement regardless of corps fundamentals. This proved to me that when time is due, the stock price will turn around and start heading to a certain price.
