One of the things I reference to find out what causes the market to move the way it does is Financial Astrology. The first time I heard the use of Financial Astrology to predict market movements, it was unbelievable and I thought even if planetary movements influenced the market more or less, it would not be accurate enough to predict the market movements to win trades in a short-term period. How could it be even possible for planets that wander around in space hundreds of millions of miles away from the earth to influence stocks listed on NASDAQ or NYSE?
Every individual and corp has their own will and reason(s) to decide what stocks to buy and sell. There is no way for anyone to understand their motive or reason due to many variables. Thus, naturally, I was fond of the Random Walk Theory (The random walk hypothesis: financial theory stating that stock market prices evolve according to a random walk and thus cannot be predicted) written by the author Burton Malkiel. Warren Buffet and Charlie Munger, many other financial gurus believe in the theory and accepted it as common sense, and was an undeniable reality to argue against the theory. Market movements are random period
However, the more I study, the more I discover strong connections between planetary movements and market patterns. I have had moments of epiphanies many times as my curiosity or simple thoughts got fulfilled by discovering the truth. It was a good feeling that I know something that no one knows. It started driving me to look into more materials and books that are available to read on Financial Astrology. There is a famous quote of Morgan’s, Morgan famously said, “Millionaires don’t use astrology, billionaires do!”. The New York library of J. P. Morgan is full of information on astrology, and there is even a zodiac painted on the ceiling. "Astrology is the study of the relationships between the movements and interactions of the planets and human behavior and the universe can be thought of as a giant clock". By understanding the timing of the planets, one can correlate them to market events because there is an undeniable link between planetary cycles and market patterns.
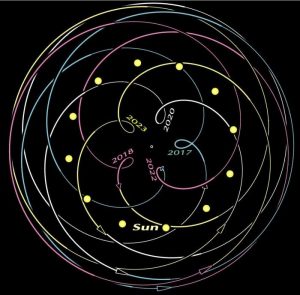
The eight-year cycle of Venus and stems from the fact that 13 Venusian orbits (8 x 224.8 days) very nearly equals eight Earth years. The 5 petals of Venus.
The image shows a simplified geocentric – Earth-centered – a plot of the orbit of Venus over 8 years, from 2016 to 2023. It is called a pentagram or a five-sided figure because, over eight years, each phenomenon – each relative position of Earth, Venus, and the sun – occurs five times. Over the next eight years, they repeat five times almost identically.

Visualizing the petals of Venus
Below is an animation, showing the orbit of Venus from an Earth-centered perspective. The smaller pale yellow dot is Venus, and the larger yellow ball is the sun: