J.P. Morgan used to say, "Millionaires don't use astrology, the billionaires do".
Truth, not many people know or understand how Financial Astrology works, not even the existence itself. Generally speaking, it is not accepted as a reliable indicator even though Financial Astrology has been around for quite a long time. Personally, I have never seen any traders/investors utilizing Financial Astrology to predict stock or commodity markets, and sadly not many Financial Astrology books are published either.
The reason for that is because it is simply incredibly difficult to correlate the planetary movements with market price movements. How do we even measure the impact or magnitude of invisible force that is coming from the planet Mars located 74.222 million miles away anyway? However, some scientists, financial institutions, and investment gurus have done research and found significant discoveries about the relationship between the movements of celestial bodies to events in financial markets.
My knowledge of financial astrology is not sufficient enough to predict market movements on a daily or weekly basis, however, I have studied enough to the point where I can strongly believe that planetary movements could influence collective human behavior to drive the economy and market price vigorously when the time comes. All my theories including the "Time Principle" are not known by anyone but me, that is the reason why it works well. With that being said, I would like to introduce one of my discoveries, the Jupiter-Uranus Aspect Cycle. This is addressed in the book "STOCK MARKET PREDICTION" and written by Donald A. Bradley.
Sidereal periods
*Sidereal periods- length of time for individual platens to revolve in their orbits
The cycle period of Jupiter: 11.86 Years (12 Years(4,333 Days))
The cycle period of Uranus: 84 Years (30,687 Days)
The Jupiter-Uranus Aspect Cycle makes one complete around the sun in 11.86 (approximately 12) years.
The length of the Jupiter-Uranus synod is 13.81 years.
*Synodical periods- length of the time between successive conjunctions of a planet with the sun.
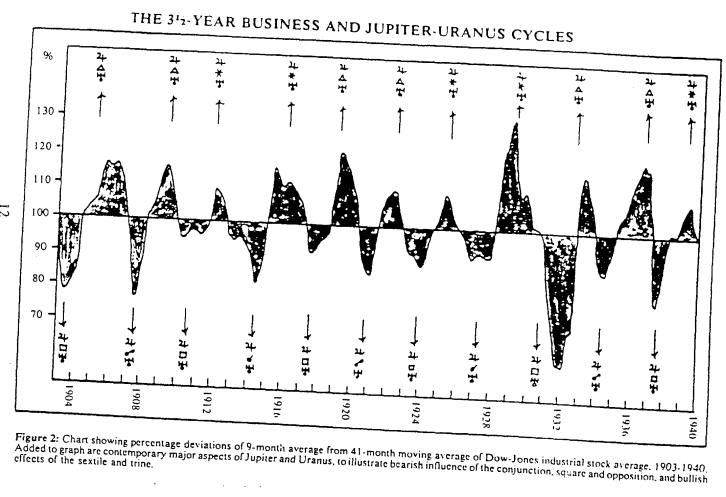
The mean interval between both heliocentric and geocentric conjunctions, squares, and oppositions of Jupiter and Uranus is 3.45 years or 41 ½ months. This periodicity is the basic component in causing the 3 ½ -year business cycle.
Conjunctions, squares, and oppositions of the Jupiter-Uranus cycle are critical, unfavorable points in the complete synod of time. The stock market, most vulnerable of all to planetary influences, continuously fluctuates with the celestial mechanism.
Sextiles and trines of the two planets designate the crests of the 3 ½ year waves.
Jupiter has long been respected by adherents to astrology as the “money planet” while Uranus has been equally well known for its connection with industry and progress. A 3 ½ -year cycle in economic affairs should be perfectly aligned with a 3 ½ -year cycle in planetary affairs. Involving the two planets' movements is called “rulers of commerce”. The Jupiter-Uranus cycle is a primary factor in the equations of mass psychology.
The 3 1/2 Year Business And Jupiter-Uranus Cycles
Sextile and Trine Aspects represent the U.S. market (Dow Jones Industrial Market) very accurately between 1900-1940s.
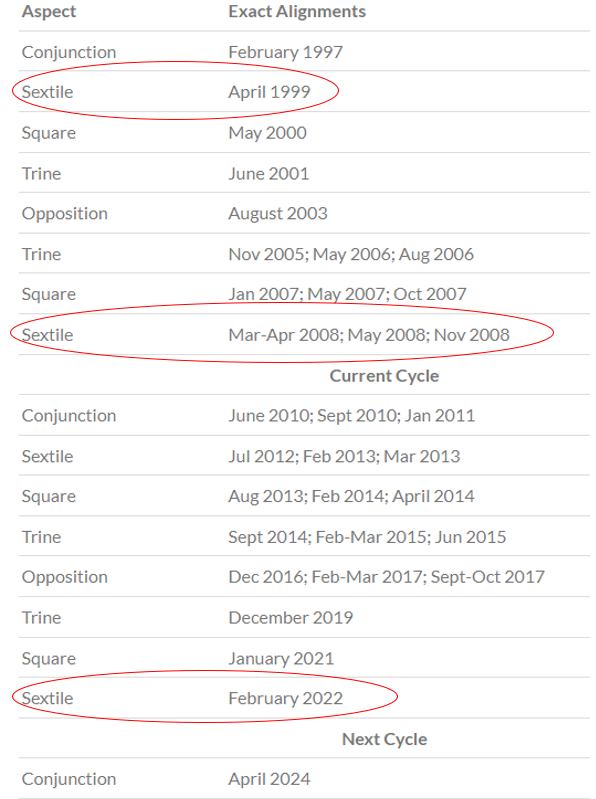
Aspect and Alignment Date of Jupiter and Uranus Cycle since 1997
Now you know when exactly Jupiter and Uranus meet each other or position at a certain angle in relation to the Sun and create magical moments. Let's take a look at the U.S. market (S&P 500) chart and see how the aspects of that influence the economy and the U.S. market.
S&P 500 Chart
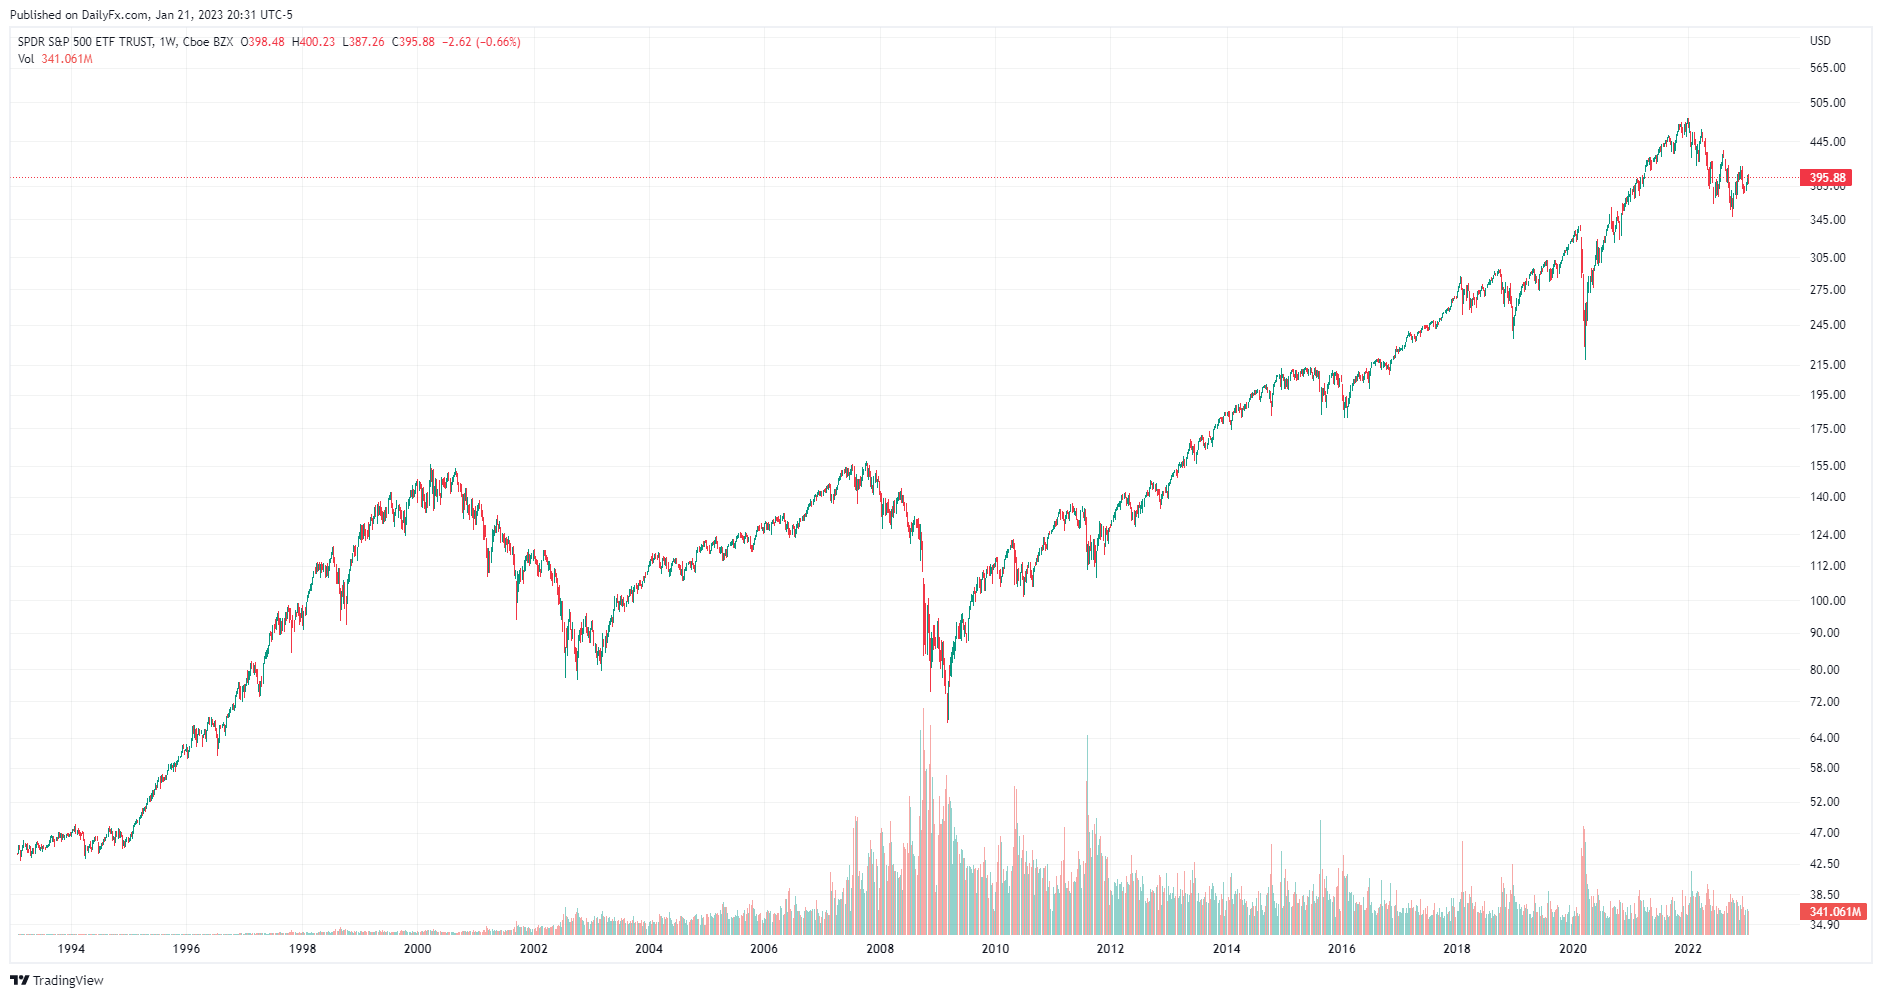
Application of the Cycles onto S&P 500
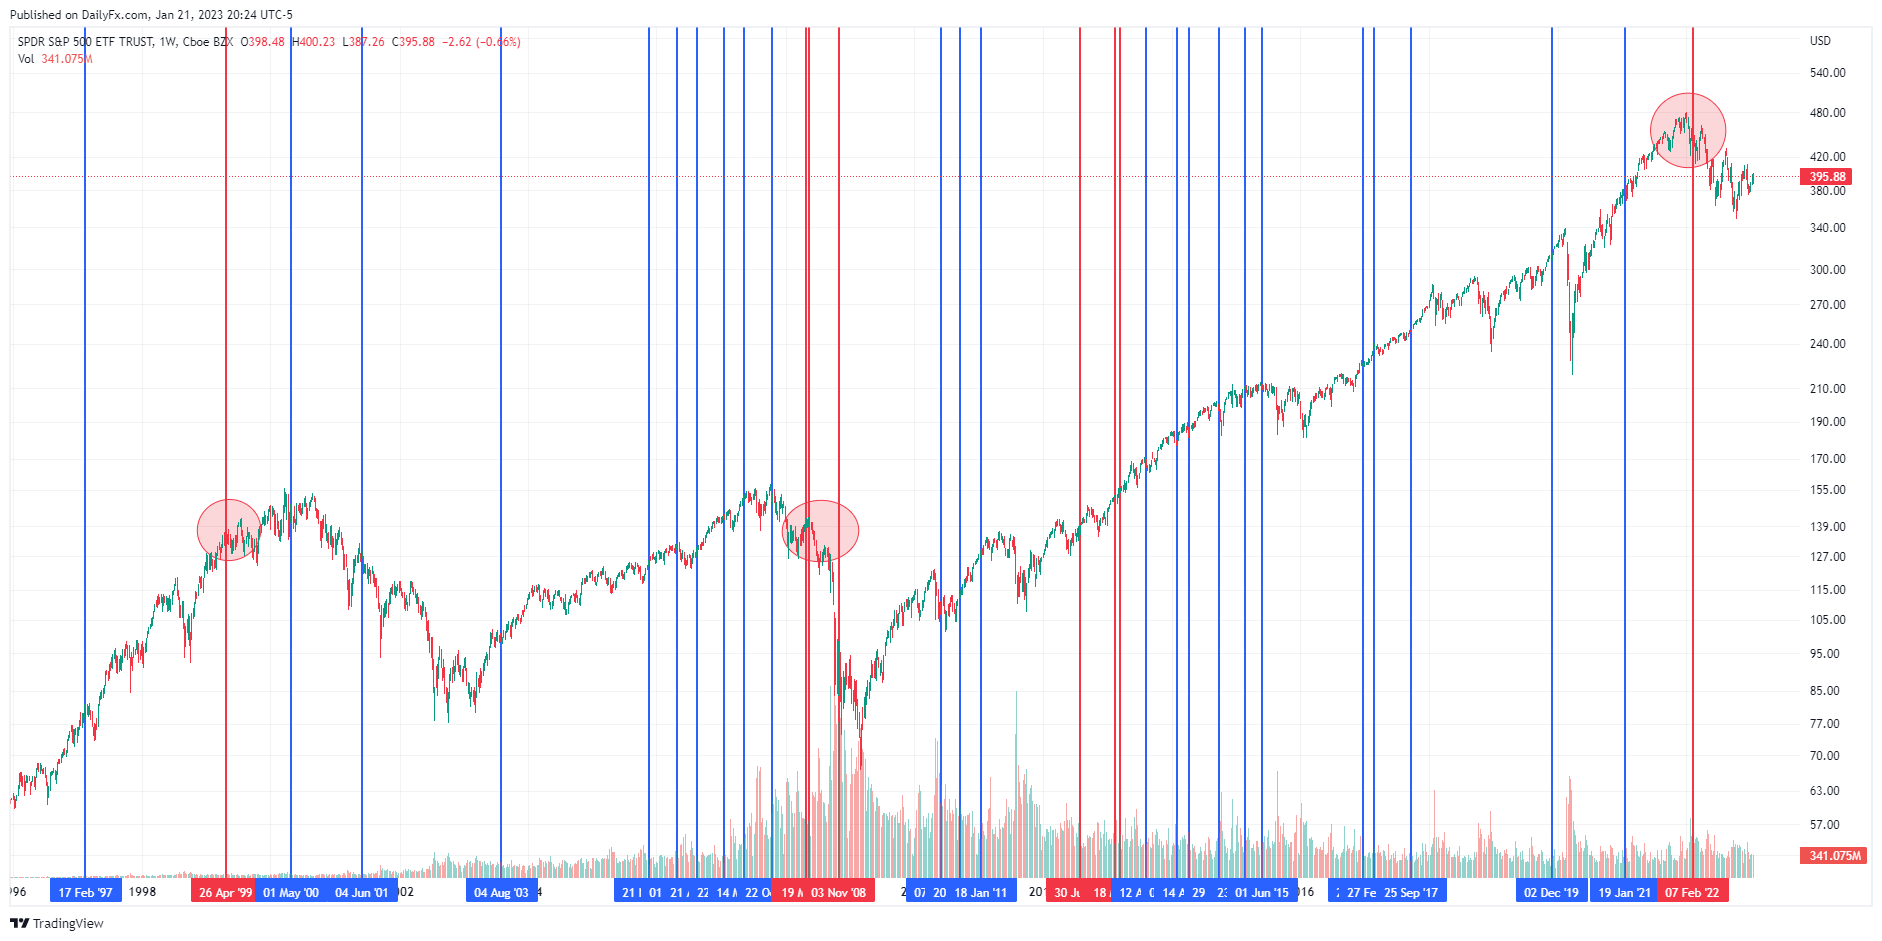
The second image shows all the aspects of Jupiter and Uranus Cycle in Red and Blue lines. Red lines repesent the Aspects of Sextile. If you just look at all the lines (Red and Blue lines), that would just confuse you and may not represent anything, however, if you filter and focus on Sextile aspect solely, the Sextile lines tell you something marvelously, the top of the U.S. economy. Three out of four times:
April 1999 -
Before the DOT.COM buble pops.
April, May and Nov. 2008 -
Before the Subprime Morgage bubble pops.
July 2012 -
No indication
February 2022 -
Before COVID-19 and Stimulus Check bubble pops. It happens right after the Russian and Ukrainian War Declaration.
Traders/Investors cannot find certainty when he picks a stock. As much as you want certainty before betting your money on stocks, there is nothing that is promise. That is the reason we have to take risks and work with probability by increasing the odds. The aspects of Jupiter and Uranus Cycle are good enough to work with historically and may be the best indicator you can find in the financial market.