The biggest challenge for traders/investors is to find an entry and an exit from the market. You see many people jump into the market and get excited and make profits as the price goes up for buy or as the price goes down for short-sell. However, once the market price starts moving against you, you would wonder if you should hold on to a stock or let go of it. I know that many assume that it is a dip and the price would go back up to where it was and become patient for a while. You can be patient for a while and hold on to the stock with hope. However, what most people encounter is lots of frustration. The market usually goes against you and keeps going down beyond your expectation and wipes out all the profits you earned, not only that your portfolio starts bleeding in red. Now you feel you are in trouble and become desperate. Does that sound familiar to you?
The only option you have at this point is to hold on to a stock until profit returns, which you do not know how long it would take, or cut the loss and move on to another stock. I am positive that ALL traders have gone through an up-and-down emotional roller coaster like that. Believe me, 99% of people end up losing in the long run because they do not know when to exit the market. If you are not sure what you are doing, the chance is less likely to win, especially, if you are using emotional status as an indicator.
To survive in the most competitive and harsh market environment, you need to come up with a plan. You need to strategize when to enter/exit the market. This is the golden rule of trading, and also applies to short-term investment. Now I can introduce you one of the very reliable indicators I utilize to predict the top and bottom of stock movements. This was discovered and introduced by W.D. Gann approximately 100 years ago and still works and is applicable to modern markets. The calculation is to find natural resistances based on an all-time low/high or extremely low/high.
To find natural resistances or tops, you need to use the all-time low or the latest extremely low price.
Formula:
Square Root (All-time low or extremely low price) +2 (Factor) = X
Square of X = Next strong resistance or Top price
You can use the formula to find out where the next strong resistance or top price going to be for your stock. These are the examples using a stock chart of TSLA, ROKU, and BDCO.
TSLA

The extremely low price $11.8 was selected and watch the price rallied to the calculated resistances. The calculation is:
Take the square root of $11.8 to get 3.4511. Adding 2 to 3.4511 to get 5.435. And square the number 5.435 to get the next resistance or top price of $29.54. If the price movement does not show any sign of resistance due to the strong momentum, you can keep calculating based on the number. Continue...
The next one is calculated as:
Take the square root of $29.54 to get 5.435. Adding 2 to 5.435 to get 7.435. And then square the number 7.435 to calculate the following next resistance, which is $55.28.
All you have to do is to repeat the calculation to get multiple natural resistances then you would find a real top price level. Actually, there is another better way to locate the top/bottom, however, this method is still reliable enough for me to increase the probability of winning. You can get out once it hits resistance and if the price movement shows strength with momentum instead of a downtrend, you can get back into the market for the next rally until you hit the next natural resistance. Eventually, you should be able to calculate and identify the strongest resistance which should be recognized as a top.
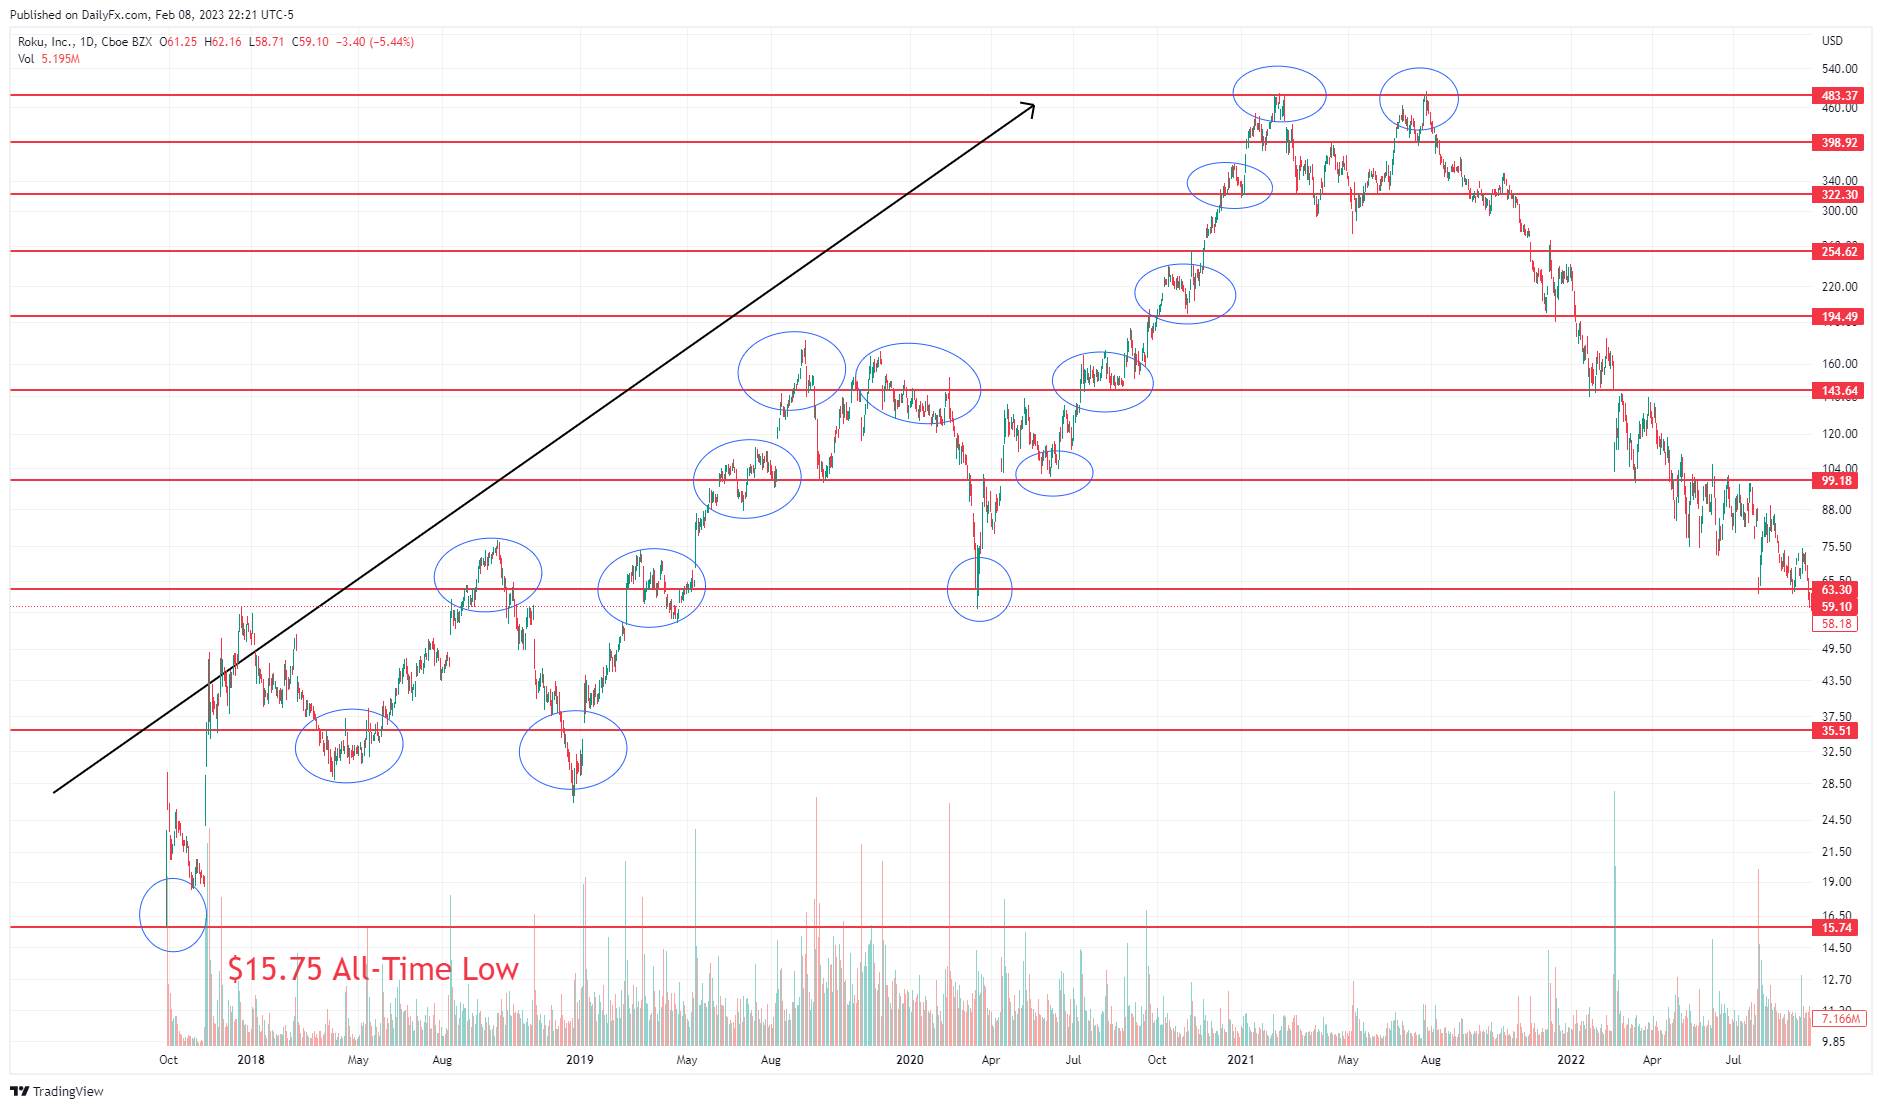
The red horizontal lines shown in the chart are natural resistances. Blue oval circles are the effect of natural resistance. What it usually does it to stay near the resistance prices and make sideway for a certain time period.
ROKU

The all-time low price of $15.75 was selected and watch the price rallied to the calculated resistances. The calculation is:
The square root of $15.75 is 3.97. Adding 2 to 3.97 to get 5.97. And then square the number 5.97 to get the next resistance or top $35.62. If the price movement does not show any sign of resistance due to the strong momentum, it should go right through the resistance. In this case, you can calculate the next resistance based on $35.62.
The next resistance or top is calculated as:
The square root of $35.62 is 5.97. Adding 2 to 5.97 to get 7.96. Then square the number 7.96 to calculate the following next resistance, which is $63.49.
Repetition of the calculation to get multiple natural resistances on the ROKU chart. As you can see, the price movements are reacting to the resistances and responding to go a sideway or turns around. Roku stock started trading at $15.74 and took 3 1/2 years to hit the top at $484.85. The top resistance is calculated as 481.8 which is only a few points off. Considering the split, I can conclude that the calculated resistance became the perfect top for ROKU stock. All other resistances, while it rallies, are also seen in the blue oval and are apparent as well.
BDCO

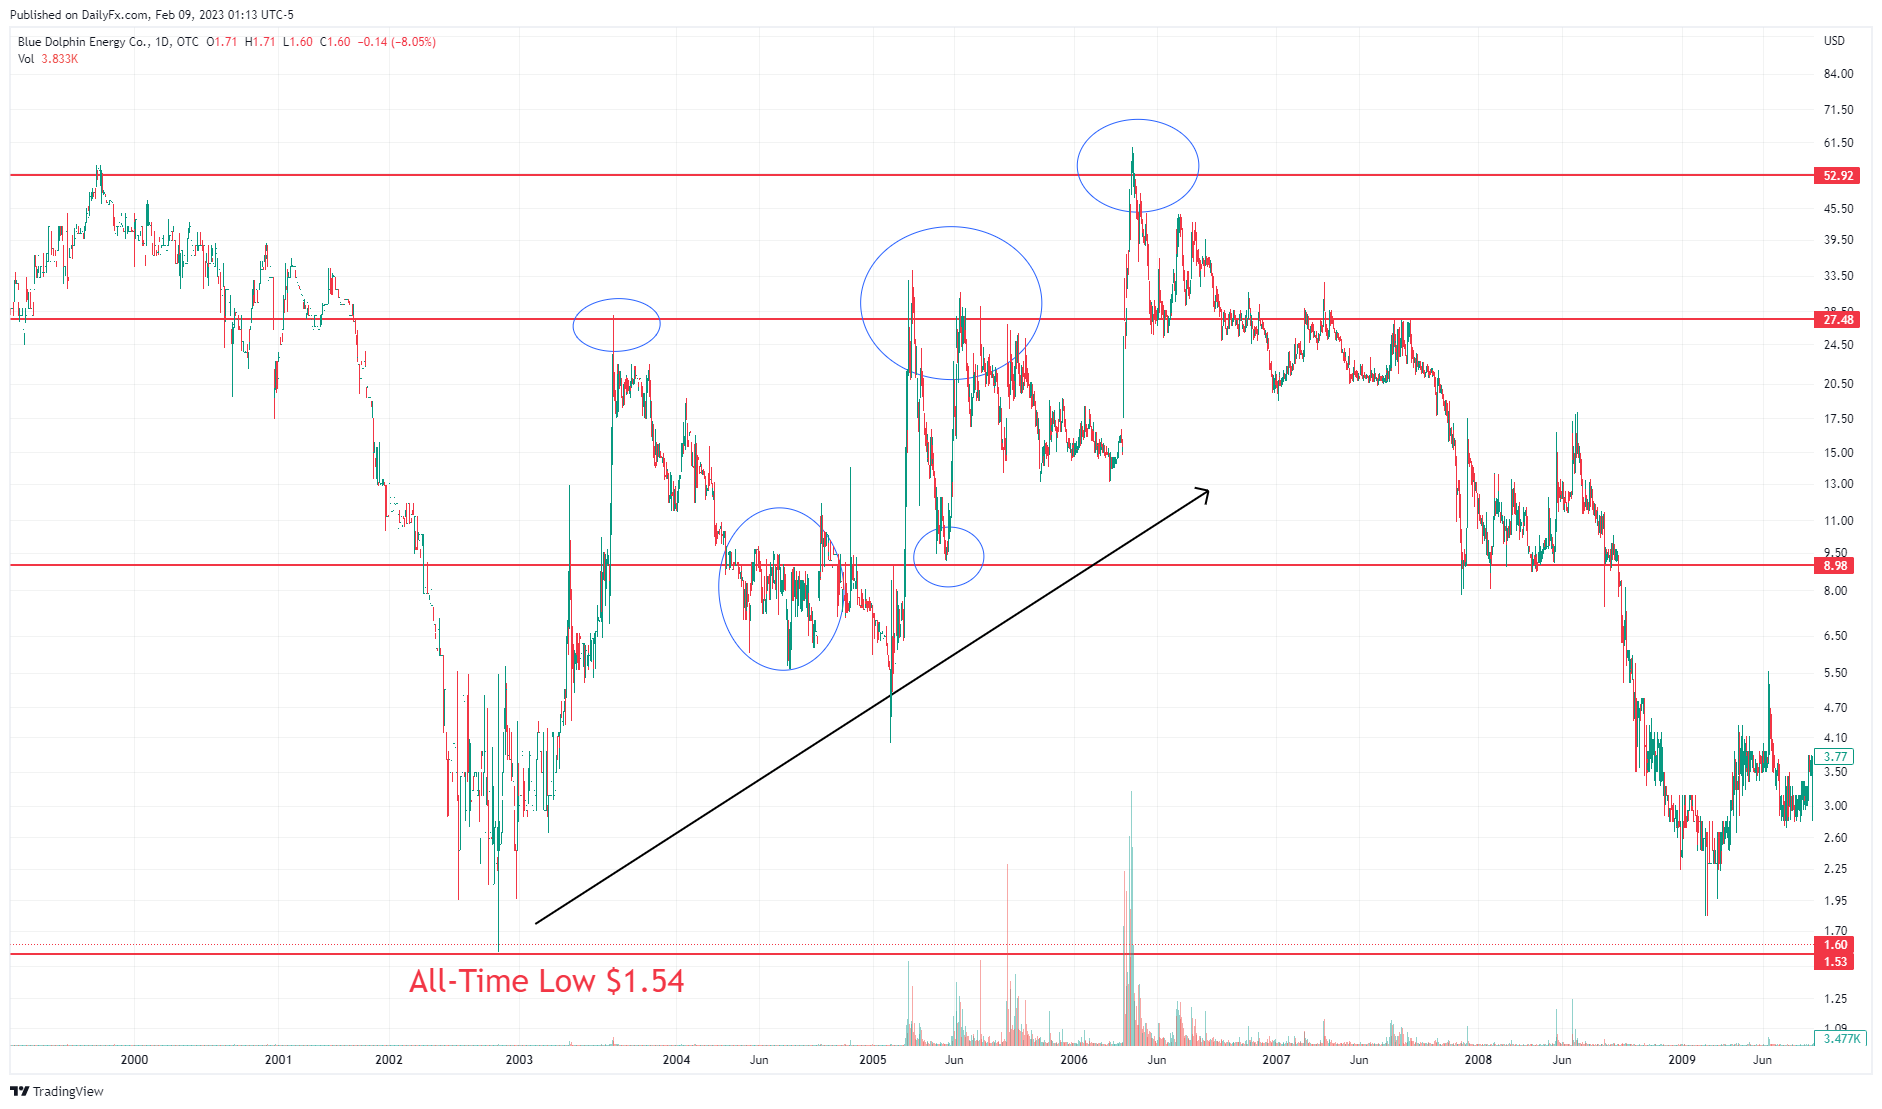
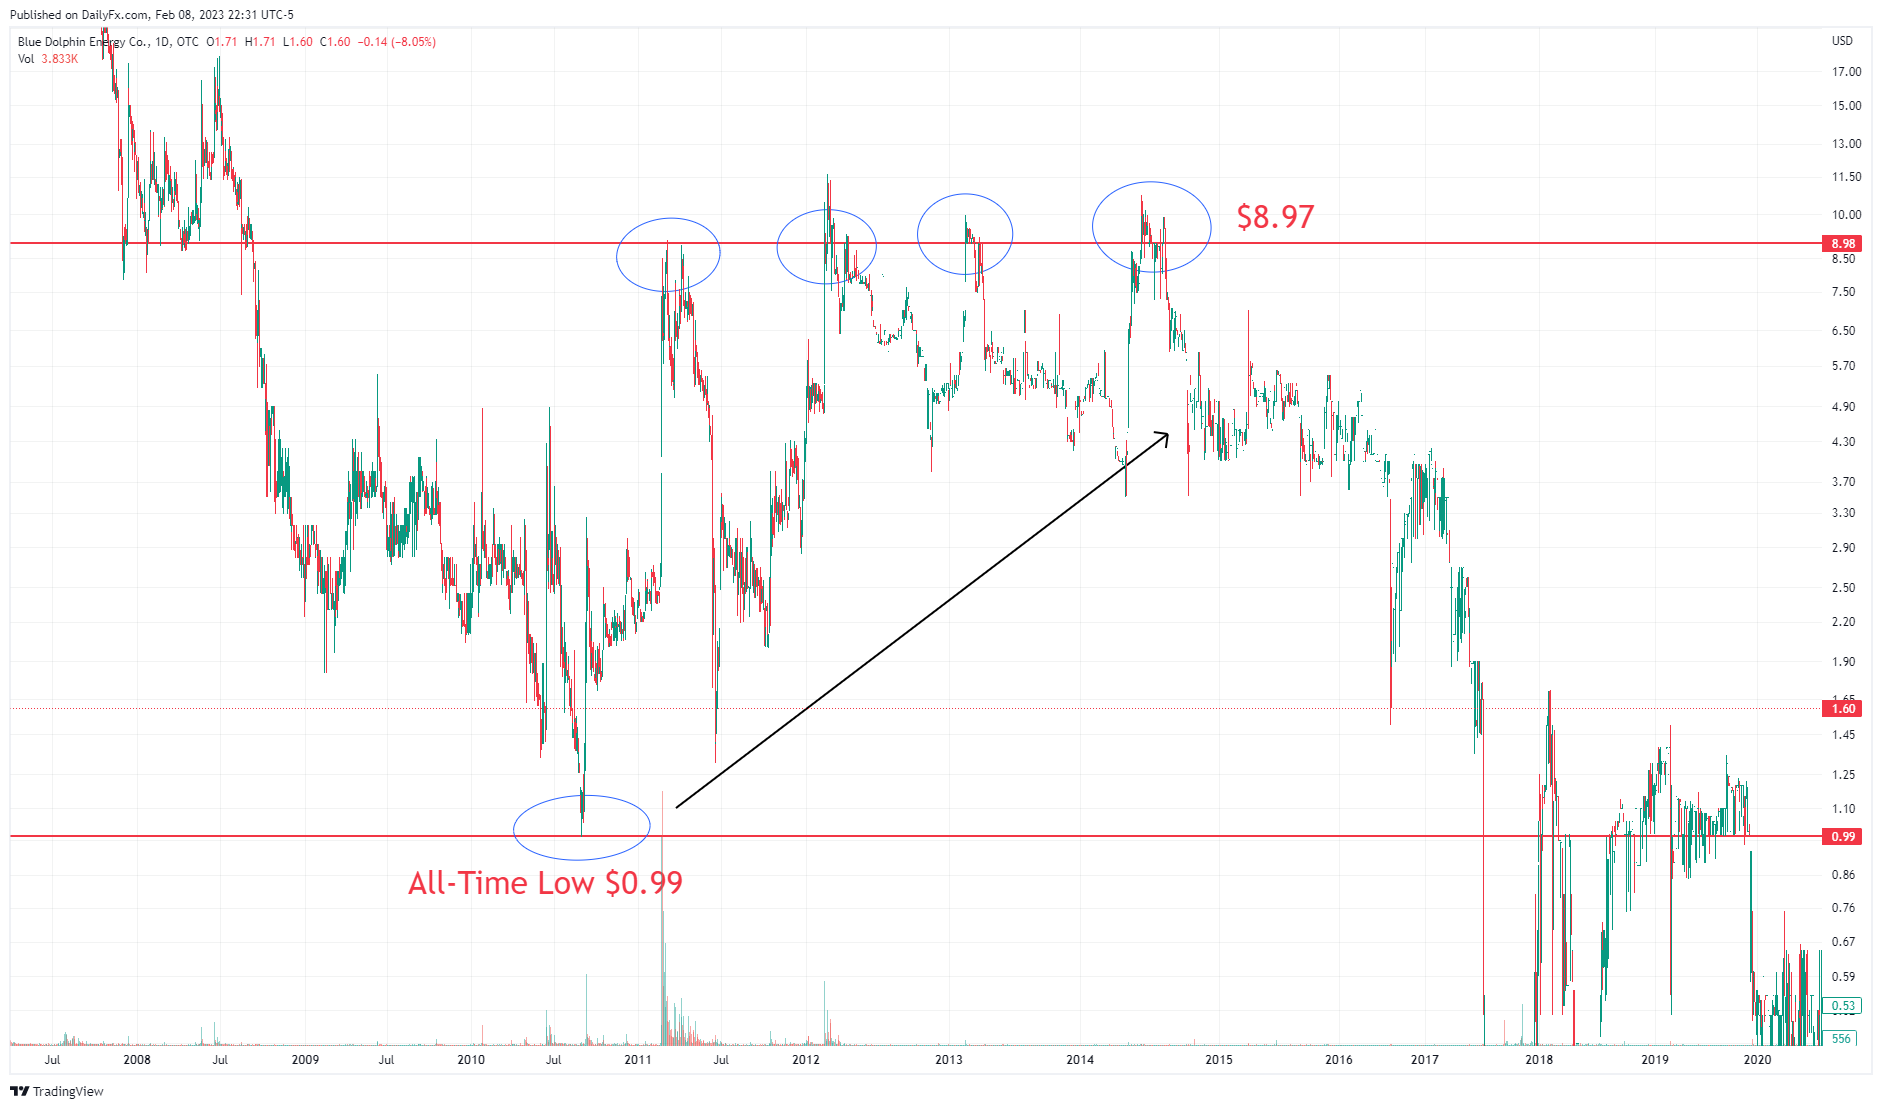
The last example is BDCO stock. It is my favorite one because of the accurate wide price movements which are in alignment with natural resistances. The BDCO price showed the movements which shift based on the formula nicely and turn around at the calculated resistances. All the calculated resistance becomes a top or a bottom which makes it easier for me to close/open transactions with optimized profits. If the price moves up to the next natural resistance, I can sell and if the price moves back down to the previous resistance line, I can buy back to aim for the next rally. A stock like that known as cyclical is easier to predict and is able to work with swing trading against TSLA or ROKU or any other value or growth stocks.
The all-time low price of $1.54 was selected and watch the price rallied to the calculated resistances. The calculation is:
The square root of $1.54 is 1.24. Adding 2 to 1.24 to get 3.24. And then square the number 3.24 to get the next resistance or top $10.50. A few of the blue oval drawings show the turnaround point at $10.5.
The next resistance or top is calculated as:
The square root of $10.5 is 3.24. Adding 2 to 3.24 to get 5.24. Then square the number 5.24 to calculate the following next resistance, which is $27.46. This line is a spot-on turnaround resistance point.
One more resistance or top point is calculated as:
The square root of $27.46 is 5.24. Adding 2 to 5.24 to get 7.24. Then square the number 7.24 to calculate another resistance, which is $52.41. This line is also a spot-on resistance point for a turnaround.

Other calculations are done with BDCO stock. As you see, the natural resistance became the important point for a turnaround very precisely The formula works and helps you to predict a top/bottom. You can try some other stocks to see which one works the best for you.