My trading strategy is to pick a specific stock that gives me a particular signal to indicate whether the stock is about to go up or go down. Theoretically, when a stock finishes going down and bottoms out, it would more likely go up, that's when I would like to buy. It is all about timing.
Do I care about what stock exchange market it is registered under? The answer to that is "Of course, YES". The major stock exchange markets that play a big role in the U.S. are NYSE and NASDAQ. Many corporations aim to be registered under these exchange markets to get recognized and raise capital to continue growing their companies. However, unfortunately, many corporations end up getting delisted or not being able to maintain the stringent criteria the major exchange markets require. Thus, they ended up staying or falling into the Over-The-Counter (OTC) market.
I prefer to find a cheap stock that is excessively undervalued in spite of its great performance under these major stock exchange markets. However, any stock that is undervalued consequently falls into the OTC market. Thus, I usually find myself looking at stocks that are registered in OTC markets. As you can see in my previous blogs, stocks I tend to select are usually coming from OTC markets and making over 1,000% of great performance so far. Let's look at the numbers provided by the credited sources to understand how easy or difficult it is to trade in OTC markets in general.
The info provided below was referenced Outcomes of Investing in OTCC Stocks by the U.S. Securities and Exchange Commission Division of Economic and Risk Analysis(DERA)
Outcomes of Investing in OTC Stocks
This paper analyzes three aspects of over-the-counter (OTC) stocks:
(1) the recent trends in the OTC stock market structure and size;
(2) the documented properties of OTC stocks; and
(3) the differences in returns based on investor and stock characteristics.
Approximately 10,000 OTC stocks were quoted at the end of 2013 through 2015, generating a total trading volume of over $200 billion per year. Dollar volume has grown substantially since 2012 and is now concentrated in the segment of the OTC market with no requirements of registration or reporting to the U.S. Securities and Exchange Commission (SEC).
A synthesis of recent academic literature reveals troubling properties of OTC stocks. Academic studies find that OTC stocks tend to be highly illiquid; are frequent targets of alleged market manipulation; generate negative and volatile investment returns on average; and rarely grow into a large company or transition to listing on a stock exchange.
This author examine the relationship between OTC investor demographics and investment outcomes using a proprietary database of transaction-level OTC data with confidential investor information. Analysis of 1.8 million trades by over 200,000 individual investors confirms that the typical OTC investment return is severely negative.
Demographic analysis reveals that older, retired, low-income, and less educated investors experience significantly poorer outcomes in OTC stock markets. Given that retail investors are the predominant owners of OTC stocks, and the documented trend towards less transparent OTC companies, the results of this study have important implications for investor protection.
Figure 4 plots the holding period returns at the individual investor level. Given that the median return (−13.4%) is less than the mean return (−10.5%), I confirm that OTC investor returns are positively skewed. Most investors experience small negative returns in OTC investments, while a few investors (2.4%) earn large positive returns greater than 100%.
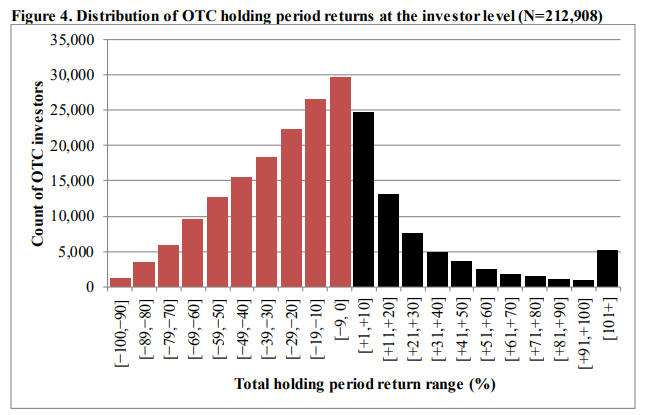
Figure 5, I present a simple pie chart of net investor-level returns in OTC stocks. The pie chart shows that 67.1% of sample investors lost money trading OTC stocks during 2014, and 32.9% experienced a gain. Thus, investors were twice as likely to lose money investing in those OTC stocks as they were to gain
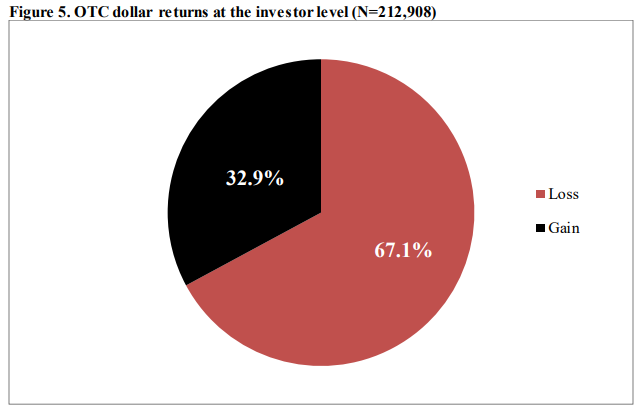
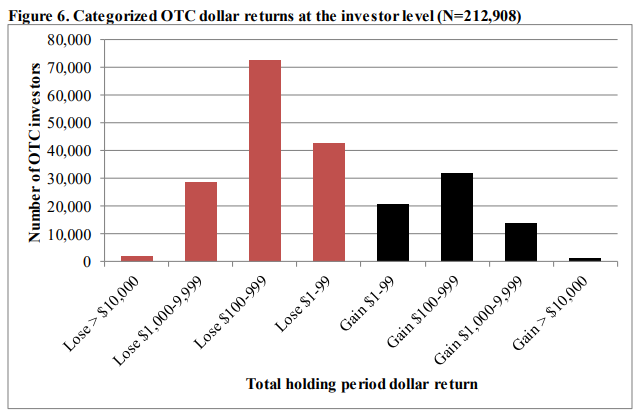
Figure 6 categorizes investor outcomes into losses or gains less than $100, or between $100 to $999, $1,000 to $9,999, and greater than $10,000. Similar to the overall losses or gains, investors are slightly greater than two times more likely to lose between $100 and $999 (72,719 observations or 34.2% of the sample) than they are to gain the same amount (31,657 observations or 14.9% of the sample). Approximately 20% of the sample (42,508 observations) loses between $1 and $99.33
As you see, the outcome of investing in OTC stocks is incredibly tough because beating the OTC market is very competitive and difficult to play with due to the limited conditions described above. A very small portion of investors can survive and be able to get a return on their investment in stocks. My recent investment was made in an oil stock (BDCO Prediction On Bull 4/12/2023). I started purchasing one oil stock significantly since Nov 2021 when it was $0.26. I invested over $38,000 into the stock in the main account and I put $12,000 into the same stock under Roth IRA over a year and a half. The stock performed very well and $12,000 ($6,000 x 2 years) became over $140,000. As of today 4/13/2023, my return on the stock is over 1,000 % and I am satisfied, which put me in the top-tier group that makes over $10,000 gain. That's what I accomplished with one OTC stock even though the economy is in a long sluggish recession. I am still optimistic about the stock and predicted to continue heading north in the near future. My ultimate expected return is over 3,500 %.

