This stock ticker is not revealed yet. It is still secret to the public and only accessible to the individuals who trusted me and was/is willing to risk to get the ticker symbol for an incredible reward in return. I am planning to reveal the name of the company and ticker symbol once it hits $10. Even with the price, I believe that it would still be undervalued and recommended to purchase until it runs off to the target of $25.
The first blog on the stock was posted on 9/18/2023 "Buy OON (Secret) Stock Registered at NYSE"
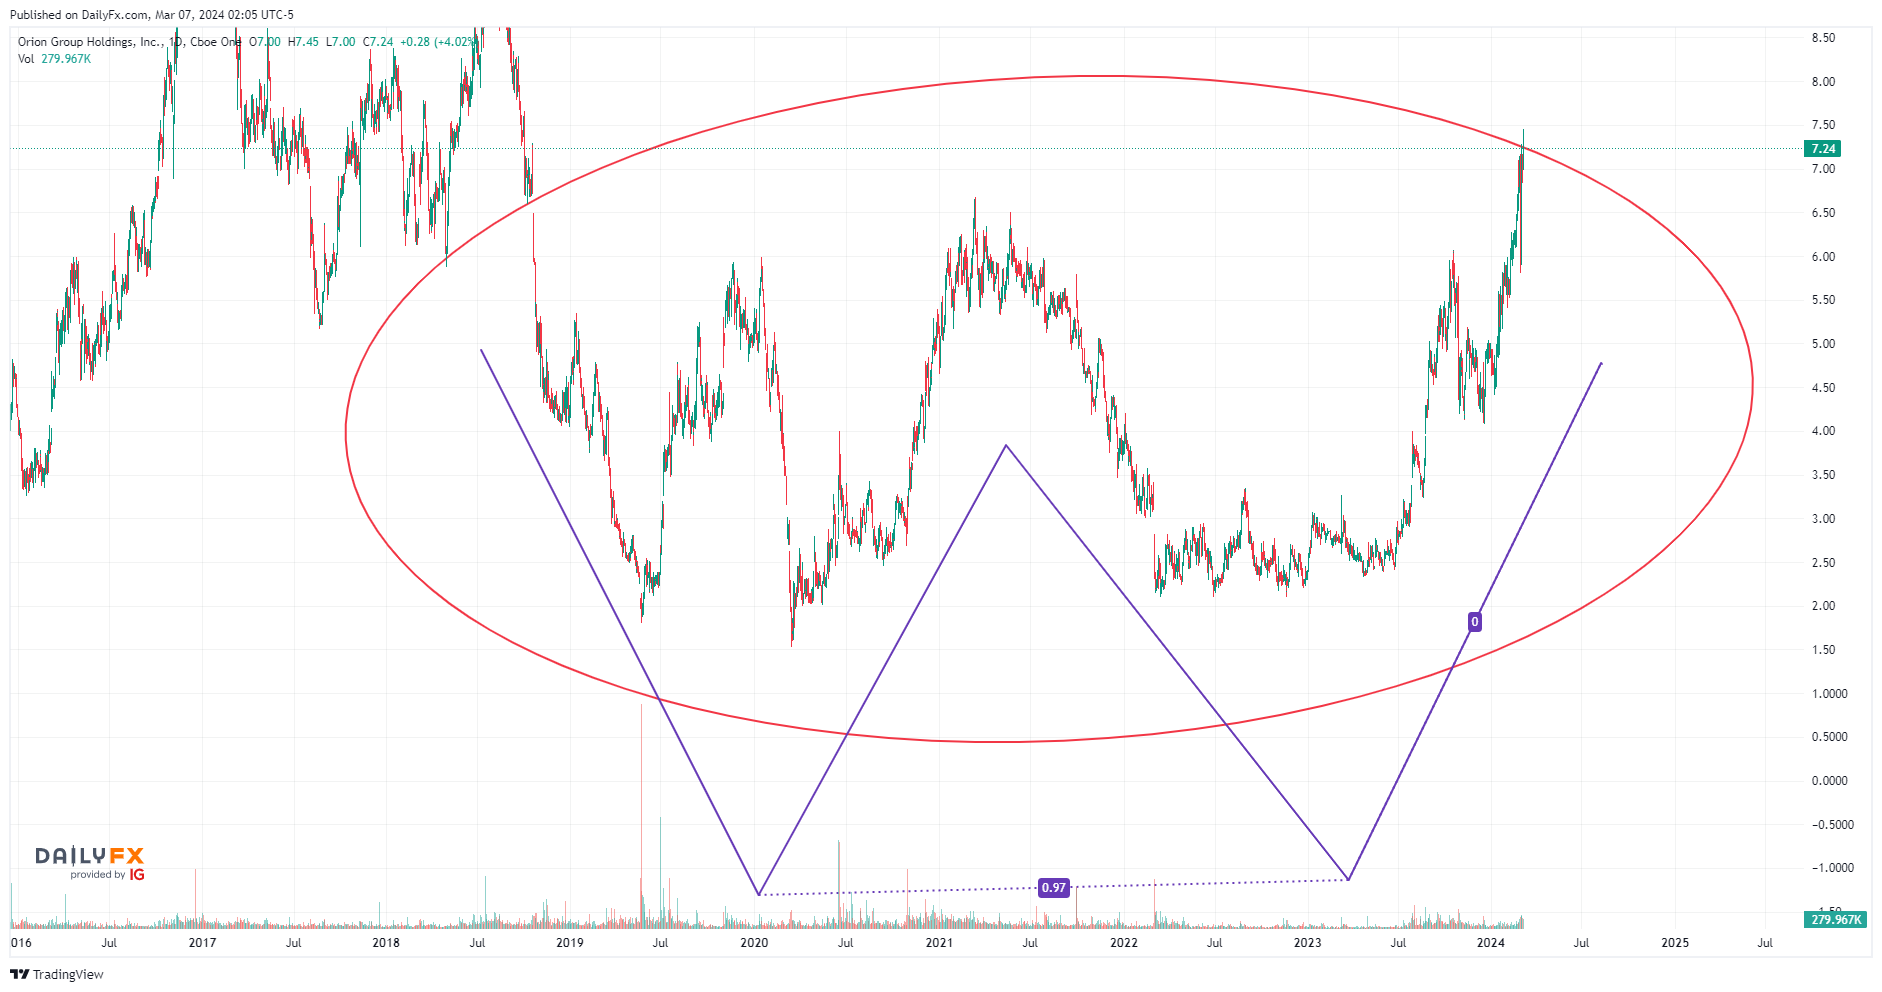
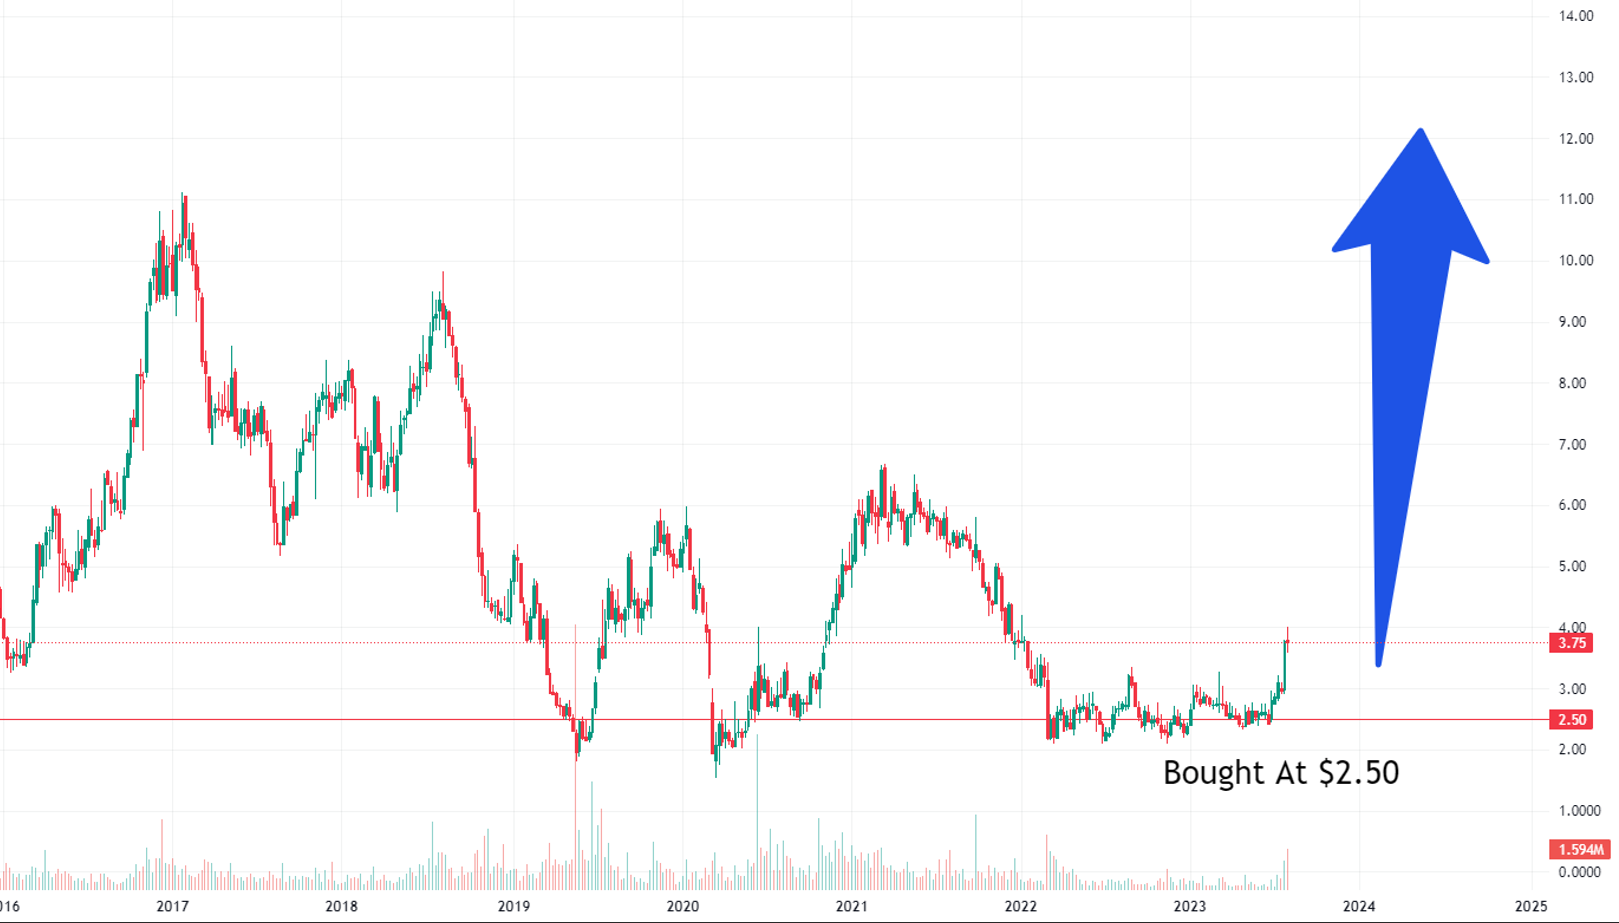
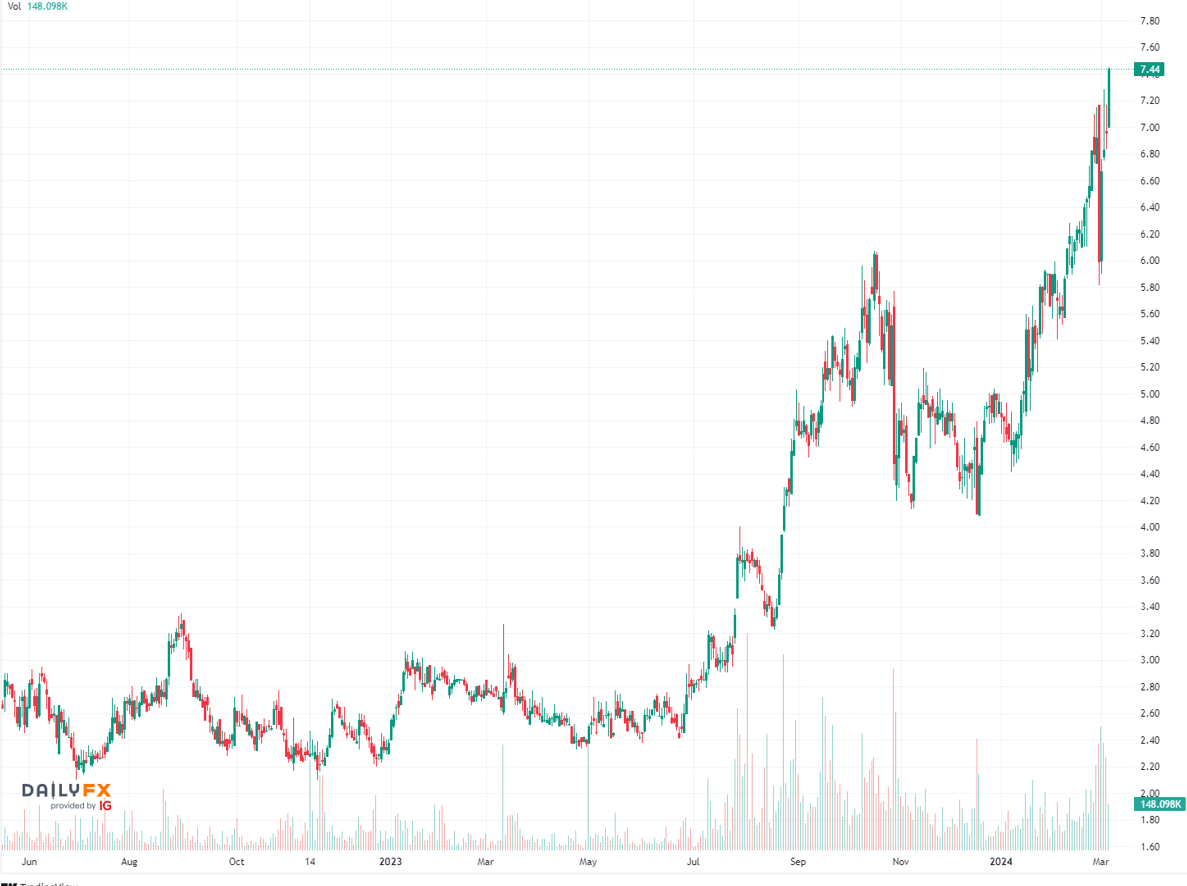
OON (secret) stock is a stock I started following since December of 2022 and began purchasing in the price range of $2.5-$3.5 around June 2023. This stock dropped over a year since 3/15/2021 down to $2.15 from $6.65 and then started making a side-way movement in the range for a year and a half afterward and then it broke out in July 2023. A side-way movement can be regarded as a phase in which people wonder if they should buy or sell shares and dispute over who is right. A dispute in a side-way movement can usually take time for a long time if it is reversal. Buyers think the market price is cheap and sellers think the market price is still overvalued. Which one is correct? Only Mr. Market knows. In this case, the side-way movement lasted over a year and a half and the market decided to turn around. That means the winner of the dispute was the buyer. The demand for buying was more than selling shares. The side-way movement became an "accumulation phase" in which people accumulated shares and contributed to reverse the movement.
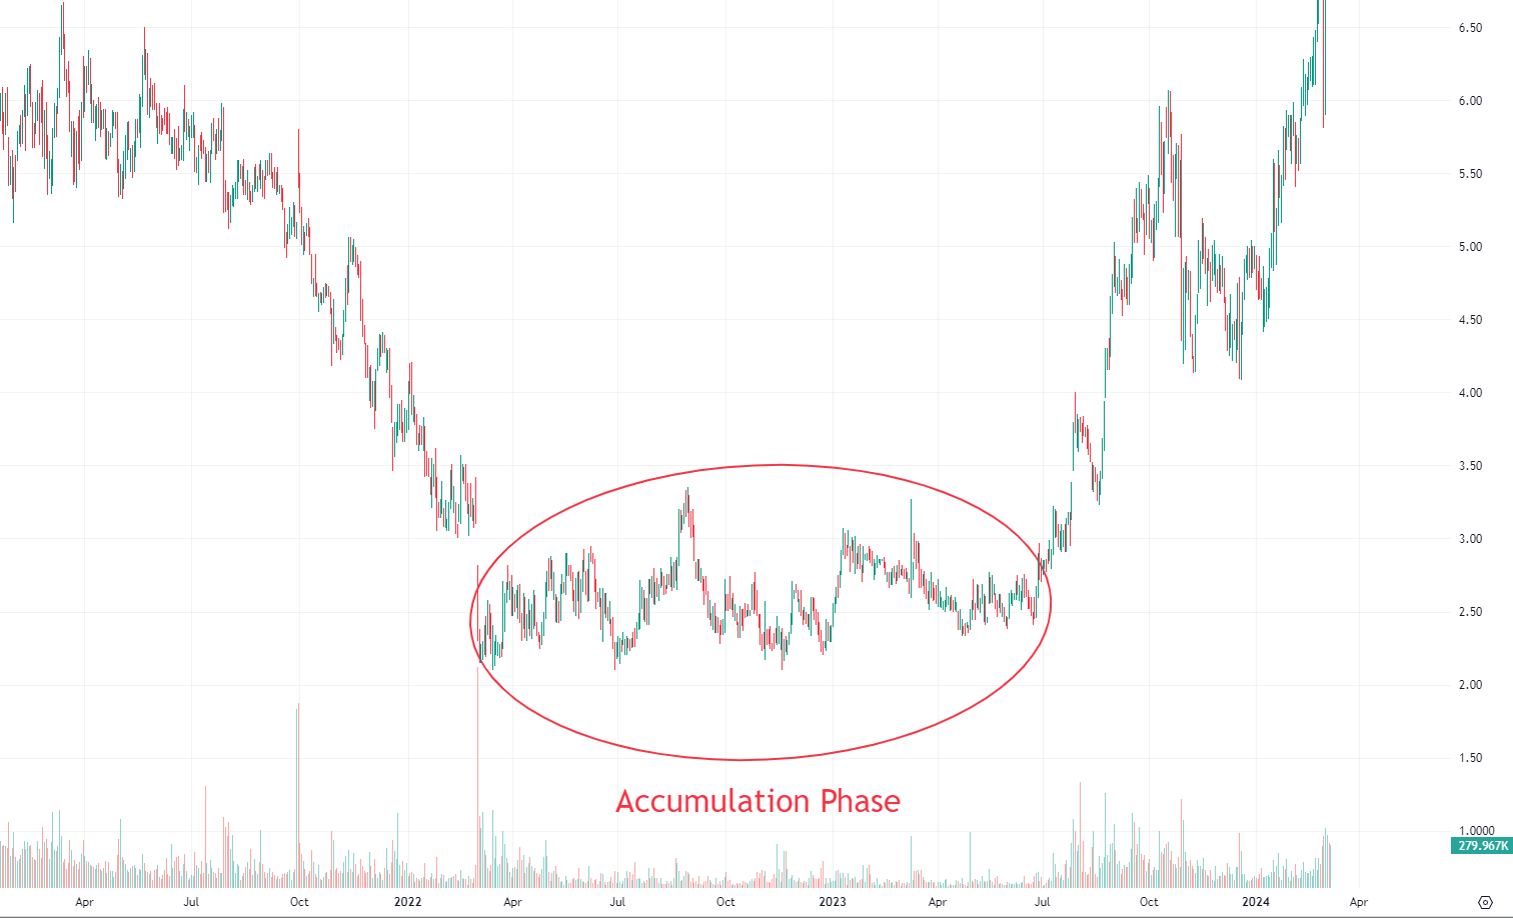
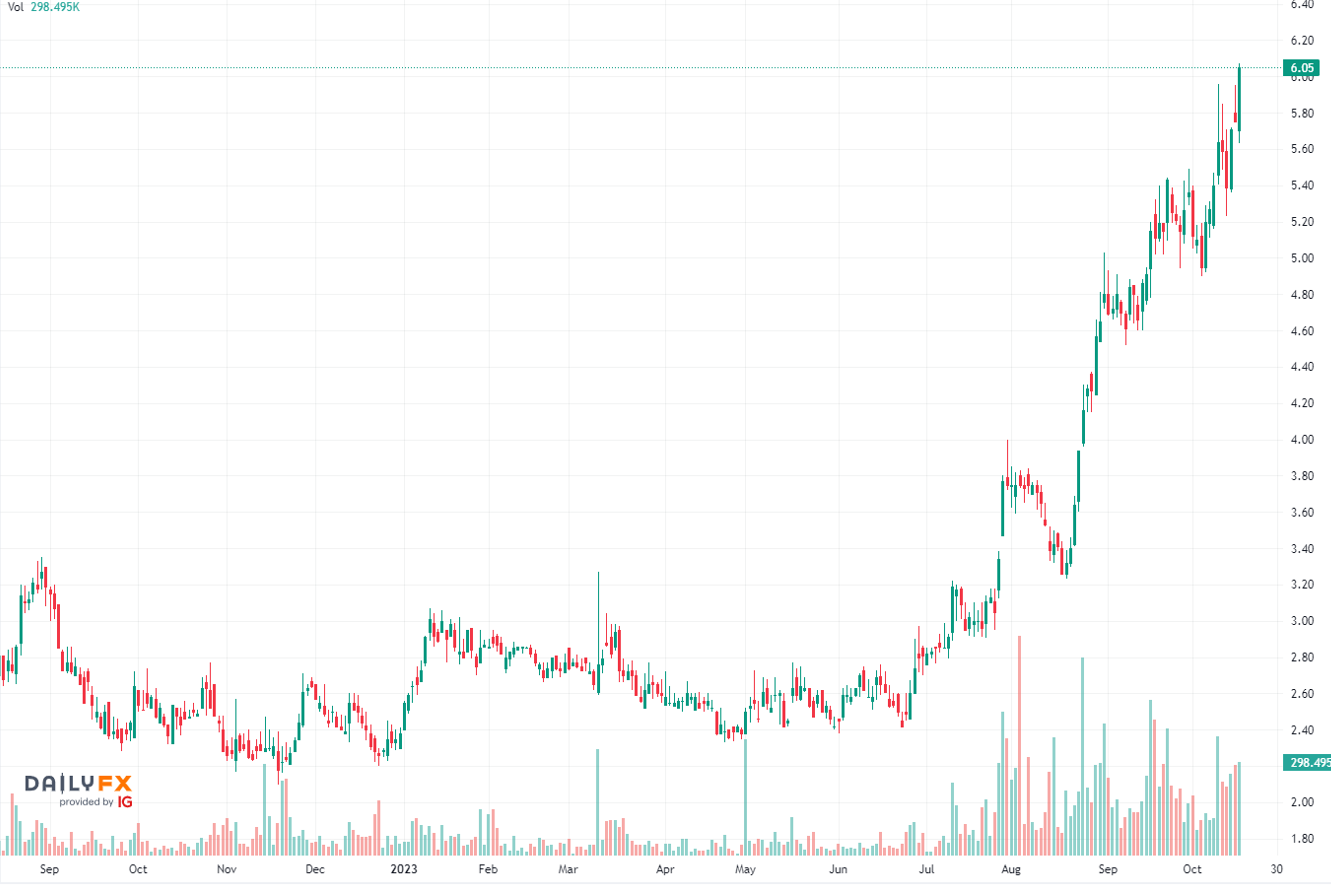
I accumulated shares with confidence, however, the stock price broke out much earlier than I expected. My initial analysis based on my theory predicted to turn around after 2024 so I thought I had enough time to accumulate the shares by the end of 2023 but it made a move 6 months early. OON (Secret) stock has been on a bull ride ever since and on this date, it hit $7.45. There was a big correction after hitting $6.00 and swang down to $4.00 offering an incredible opportunity for investors, however, it didn't last for a long time due to the strong momentum and it brought the price back to $6.00, and went up way beyond the price and it is about to shoot off the chart.
Another reliable indicator also shows that it will keep going up in the weekly chart. The name of the technical indicator is the "Double Bottom" pattern. The price just hit the neckline and formed the beautiful Double-Bottom indicating to go much further. It is a simple but very reliable indicator and has proven to work in many cases. Nothing is certain even my theory of "Time Principles" or "Reflexivity" established by George Soros, or "Elliot Wave Theory" etc. That's why we need to work with probability with a reliable edge. Now we have one here.