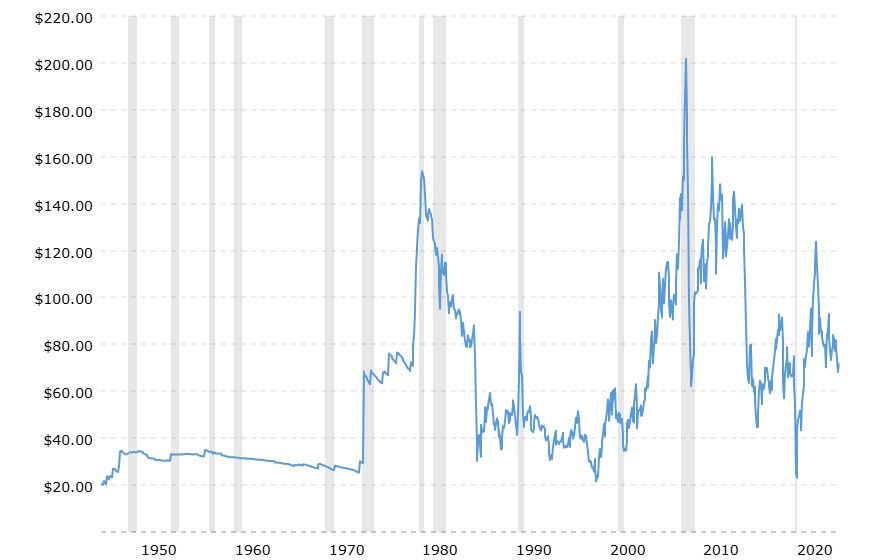
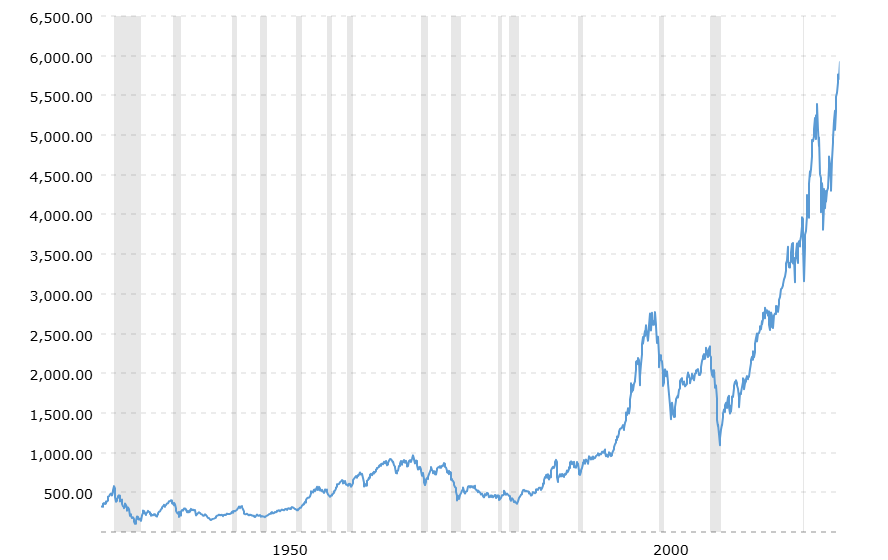
The price of Crude Oil and the S&P 500 seem to have a multifaceted relationship and interfere with each other in positive and negative impacts. That makes it difficult for investors to predict which direction to move, up or down. The nature of the Crude Oil price movement is just like any other commodity, it is cyclical. On the other hand, the performance of the S&P 500 has proven last 90 years that it always rises with an annual average of around 10% or 12% with dividends reinvested.


As you can see from these charts, the difference in the price movements is quite obvious. Usually, a retirement account is tied to the S&P 500 and accumulates wealth over time so you do not have to do anything until 591/2. You can be optimistic and expect that you get an average annual return of 10% as companies grow and you would be well off after retirement. Imagine, if you tied your retirement account to Crude Oil, waited around for 35 years, and found your account still the same value as when you started. It wouldn't be funny, would it? The price movement of crude oil is cyclical and does not seem to provide satisfactory results for investors over the long period, however, on Wall Street, traders and short-term investors have proven that trading in commodities is more profitable than the general market. That means if you research and find an edge that indicates the top and bottom of price movement in commodities, it would allow you to get ahead of the S&P 500.
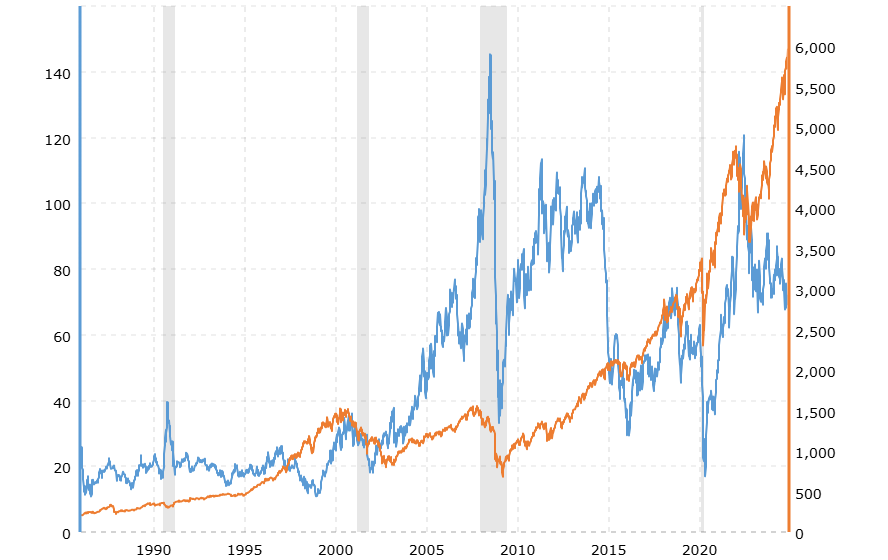
Let's take a close look at the relationship between the price movements of Crude Oil and the S&P 500. Knowing the facts that the nature of these price movements is contradictory and does not seem to share similar characteristics, however, there is an interesting correlation to be found by comparing these charts. The first picture displays the overlap of both charts and shows that as the S&P 500 climbs, Crude Oil seems to follow right after and climb as well. This relationship becomes apparent in the long term. The price of Crude Oil seems to lag after the S&P 500 and when the price of the S&P 500 tops, Crude Oil follows and tops right after.

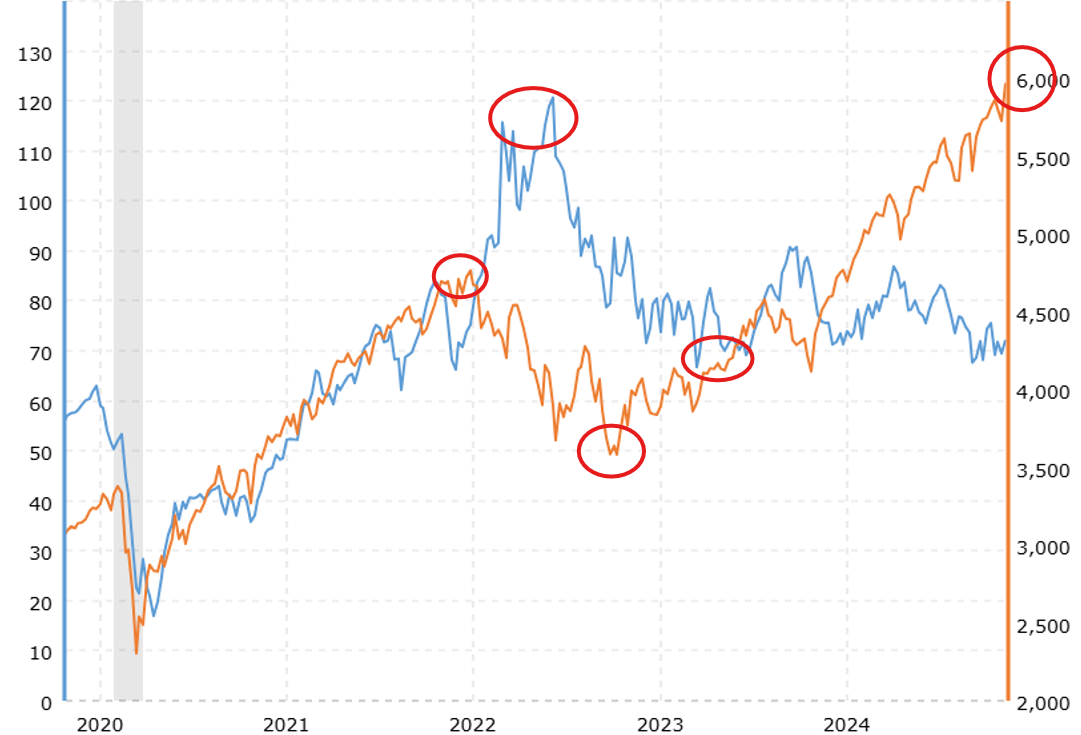
Now, we take a look at another picture that shows the movements of Crude Oil and the S&P 500 price in the last 5 years. This is a confirmation, that shows the hypothesis is more likely correct not only in the long term but also in the short term. It shows exactly what it was described as above. The orange line represents S&P 500 and the blue line represents Crude Oil. As you can see, the blue line is following the orange line. When the S&P 500 hit $4,725 on 12/20/2021 and topped, Crude Oil also topped 2 months after. The same phenomenon is happening one after another. That indication allows me to predict that the oil price will go up soon, however, currently, Crude Oil and the S&P 500 price are diverging as of today 11/8/2024.
According to my theory, Time Principles, the following top of the Crude Oil is in the range between the end of 2026 - the beginning of 2027.
